Unit economics, payroll discipline, and real-time location visibility, delivered by a CFO team that standardizes reporting, improves profitability, and keeps every site audit ready.
Unit economics, payroll discipline, and real-time location visibility, delivered by a CFO team that standardizes reporting, improves profitability, and keeps every site audit ready.
From SaaS and manufacturing to multi-location retail and Web3, Valua Partners supports management teams where finance precision determines growth velocity.


Standardize reporting, control labor and COGS, and see unit-level performance in real time, so every location scales profitably.
Multi-location businesses generate fragmented data across POS, payroll, inventory, and banking, often in different systems and schedules. Valua Partners builds a single finance backbone that reconciles the numbers, standardizes location reporting, and delivers dependable unit economics every week. You get clean KPIs, faster closes, and performance insights you can act on across every store, studio, or franchise.

We build a unified reporting layer across every location, so leaders can see performance by store, region, and brand with confidence. From clean unit P&Ls to labor optimization and board-ready reporting, you get standardized metrics that reduce surprises and drive faster decisions, whether you operate 5 locations or 500.
Standardized P&Ls by store, region, brand, and franchise, weekly or monthly.
Labor % and productivity tracking tied to sales, staffing, and targets.
Near real-time snapshots on sales, labor, and margin, so you course-correct fast.
Measure promo lift, margin impact, and payback by location and channel.
Consolidated reporting packs with benchmarks, trends, and variance explanations.
We architect a finance stack that scales, integrating POS, payroll, expenses, and accounting into a single source of actionable information. Standardized mappings, role-based controls, and automated validations keep location data clean, close cycles faster, and produce reporting that stands up to lenders, investors, and audits.
Multi-location finance gets messy fast – multiple POS systems, payroll cycles, and inconsistent reporting. We standardize your data, automate reporting, and deliver location-level insights leadership can trust.
Yes. We integrate POS, payroll, and banking data into your accounting and reporting stack so location performance is captured consistently. We standardize chart-of-accounts mapping across stores, validate data quality, and build repeatable workflows so reporting stays reliable as you add locations.
As detailed as you need them to be, by store, region, concept/brand, franchisee, channel (in-store vs. delivery), and department. We can also layer in unit economics such as sales per labor hour, contribution margin, and controllable vs. non-controllable expenses.
We separate “signal vs. noise” by tagging promos, holidays, and seasonality in your reporting. That allows clean comparisons (YoY, same-store, same-week) and helps you understand true margin impact, staffing efficiency, and promo ROI, without overreacting to one-off spikes.
Yes. We create standardized dashboards that show franchisee performance, compliance with reporting requirements, and benchmarking versus system averages. For franchisors, we can also build reporting packs that support lender, board, and investor discussions.
Yes. We support cross-border groups by designing consistent reporting across entities and jurisdictions, aligning multi-currency consolidation, and coordinating tax/compliance workflows so leadership sees one set of numbers.
Most clients see meaningful improvements quickly once systems and mappings are aligned. We typically start by stabilizing data sources, standardizing the chart of accounts, and producing a clean first set of location P&Ls, then we automate and expand from there.
Absolutely. We integrate into your current finance function and coordinate responsibilities across bookkeeping, month-end close, and reporting. If you already have external tax or audit providers, we align schedules and deliverables to reduce rework and surprises.
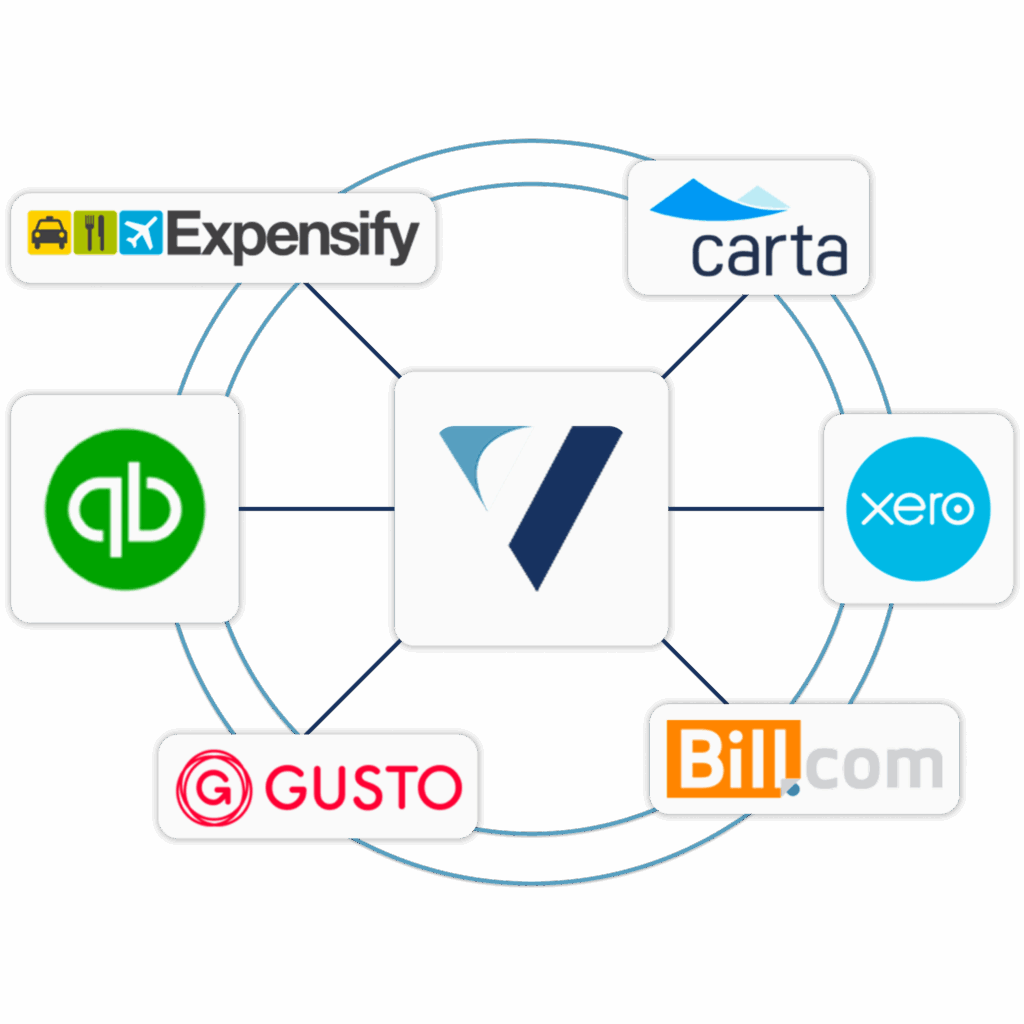
We work across modern accounting and ops stacks (POS, payroll, expense, bill pay, inventory, and banking tools). Our approach is platform-agnostic: we design the workflow around your operations and reporting needs, then configure the tools to match.
We don’t just “close the books.” We build a repeatable operating system for multi-location reporting, standardized unit P&Ls, labor intelligence, promo ROI, and board-ready performance packs, so leadership can scale with control.
Yes. We integrate POS, payroll, and banking data into your accounting and reporting stack so location performance is captured consistently. We standardize chart-of-accounts mapping across stores, validate data quality, and build repeatable workflows so reporting stays reliable as you add locations.
As detailed as you need them to be, by store, region, concept/brand, franchisee, channel (in-store vs. delivery), and department. We can also layer in unit economics such as sales per labor hour, contribution margin, and controllable vs. non-controllable expenses.
We separate “signal vs. noise” by tagging promos, holidays, and seasonality in your reporting. That allows clean comparisons (YoY, same-store, same-week) and helps you understand true margin impact, staffing efficiency, and promo ROI, without overreacting to one-off spikes.
Yes. We create standardized dashboards that show franchisee performance, compliance with reporting requirements, and benchmarking versus system averages. For franchisors, we can also build reporting packs that support lender, board, and investor discussions.
Yes. We support cross-border groups by designing consistent reporting across entities and jurisdictions, aligning multi-currency consolidation, and coordinating tax/compliance workflows so leadership sees one set of numbers.
Most clients see meaningful improvements quickly once systems and mappings are aligned. We typically start by stabilizing data sources, standardizing the chart of accounts, and producing a clean first set of location P&Ls, then we automate and expand from there.
Absolutely. We integrate into your current finance function and coordinate responsibilities across bookkeeping, month-end close, and reporting. If you already have external tax or audit providers, we align schedules and deliverables to reduce rework and surprises.
We work across modern accounting and ops stacks (POS, payroll, expense, bill pay, inventory, and banking tools). Our approach is platform-agnostic: we design the workflow around your operations and reporting needs, then configure the tools to match.
We don’t just “close the books.” We build a repeatable operating system for multi-location reporting, standardized unit P&Ls, labor intelligence, promo ROI, and board-ready performance packs, so leadership can scale with control.
Bring all your financial data together – payroll, sales, and profitability – in one cohesive reporting system.

This is a simplified template that allows you to create your own PE distribution waterfall for returning capital to the LPs, GPs, etc with different fund structures. It’s plug-and-play: enter your own numbers (or formulas) and the outputs will auto-populate.
This template is a simplified 3-statement model with a DCF and Weighted Average Cost of Capital (WACC) to demonstrate how the Enterprise Value and Equity Value of a company is determined. It’s plug-and-play: enter your own numbers (or formulas) and the outputs will auto-populate.
Build a private equity LBO model using flexible financing/debt inputs and supporting schedules. It’s plug-and-play: enter your own numbers (or formulas) and the outputs will auto-populate. The template also includes all three financial statements, a discounted cash flow (DCF) analysis, and a sensitivity analysis.
A guide to building finance-grade models with clean inputs, defensible assumptions, and stakeholder-ready outputs, including how the three statements connect and how to structure models that hold up in diligence.
Download our walkthrough of how to prepare for a valuation, what information matters most, and how professionals triangulate value using income, market, and asset-based approaches.
Use this checklist to gather documents before we prepare your T3 Trust Income Tax and Information Return. If you’re unsure about an item, include what you have, we’ll confirm what’s required.